
Page 100 - Anuario FFCC - 2023
P. 100
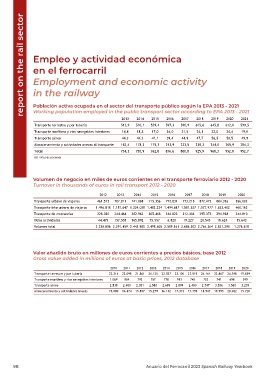
report on the rail sector


               Empleo y actividad económica

               en el ferrocarril

               Employment and economic activity

               in the railway


               Población activa ocupada en el sector del transporte público según la EPA 2013 - 2021
               Working population employed in the public transport sector according to EPA 2013 - 2021
                                                     2013  2014   2015  2016  2017   2018  2019   2020  2021
                Transporte terrestre y por tubería   512,9  510,1  529,4  597,3  590,9  615,6  645,8  612,0  599,5
                Transporte marítimo y vias navegables interiores  14,8  18,3  17,0  26,0  21,5  24,3  22,0  24,4  19,0
                Transporte aéreo                     44,2  44,2   41,1  39,4   44,9  47,7  56,5   50,5  49,9
                Almacenamiento y actividades anexas al transporte  162,4  178,3  175,3  213,9  223,5  238,3  244,0  265,9  284,3
                Total                                734,3  750,9  762,8  876,6  880,8  925,9  968,3  952,8  952,7
                Ud. miles de personas


               Volumen de negocio en miles de euros corrientes en el transporte ferroviario 2012 - 2020
               Turnover in thousands of euros in rail transport 2012 - 2020

                                            2012   2013   2014    2015   2016   2017   2018   2019     2020
                Transporte urbano de viajeros  461.573  707.811  741.088  715.356  772.831  773.215  872.472  884.326  556.002
                Transporte interurbano de viajeros  1.496.818 1.181.647 1.234.038 1.402.224 1.494.687 1.581.527 1.577.977 1.623.402  460.163
                Transporte de mercancías   228.030  244.464  302.962  305.468  314.822  312.333  295.372  294.938  244.810
                Otras actividades          44.475  157.538  165.892  75.557  6.820  19.227  20.543  18.624  15.643
                Volumen total             2.230.896 2.291.459 2.443.980 2.498.605 2.589.161 2.686.302 2.766.364 2.821.290  1.276.618


               Valor añadido bruto en millones de euros corrientes a precios básicos, base 2012
               Gross value added in millions of euros at basic prices, 2012 database

                                                2010  2011  2012  2013  2014  2015  2016  2017  2018  2019  2020
                Transporte terrestre y por tubería  22.214  22.095  21.861  21.125  22.027  23.100  23.515  24.161  22.867  24.398  19.839
                Transporte marítimo y vias navegables interiores  1.069  904  792  757  778  913  740  753  741  698  399
                Transporte aéreo                2.538  2.400  2.381  2.580  2.689  2.899  2.480  2.747  3.536  3.560  3.235
                Almacenamiento y actividades anexas  15.080  16.474  15.897  15.279  16.142  17.315  17.755  18.947  19.995  20.402  15.728


       98                                                      Anuario del Ferrocarril 2023 Spanish Railway Yearbook